Financial Highlights
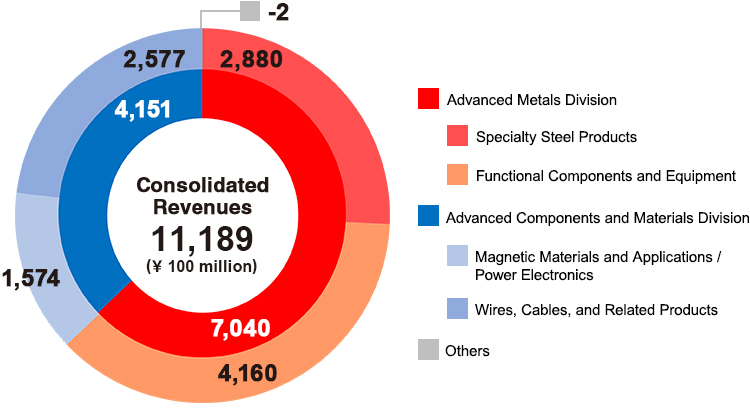
Revenues by Business Segment (as of Mar,31,2022)
Financial Highlights
(Consolidated basis)
-
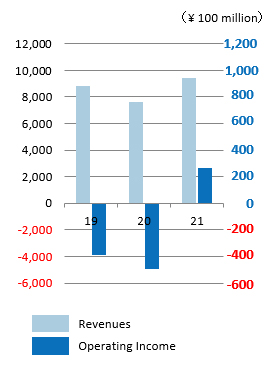
Revenues and Operating Income (IFRS)
-
Net Income(Loss) and
Net Income(Loss) per Share(Basic) (IFRS)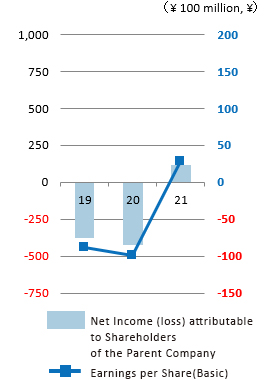
-
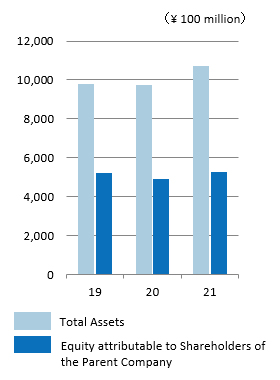
Total Assets and Equity attributable to Shareholders of the Parent Company (IFRS)
Trends in Performance (based on IFRS)
| 3/2020 | 3/2021 | 3/2022 | |
|---|---|---|---|
| Revenues | 8,814 | 7,616 | 9,427 |
| Adjusted Operating income | 144 | (50) | 268 |
| Operating income | (391) | (492) | 267 |
| Net income attributable to Shareholders of the Parent Company | (376) | (423) | 120 |
| Earnings per Share attributable to Shareholders of the Parent Company (Basic, \) | (88.05) | (98.90) | 28.14 |
| Equity attributable to Shareholders of the Parent Company | 5,203 | 4,897 | 5,276 |
| Total Assets | 9,778 | 9,722 | 10,697 |
| ROE (%) | - | - | 2.4 |
| Equity attributable to Shareholders of the Parent Company Ratio (%) | 53.2 | 50.4 | 49.3 |
| Equity per Share attributable to Shareholders of the Parent Company (\) | 1,216.92 | 1,145.26 | 1233.91 |
| Capital expenditure | 530 | 288 | 343 |
| Depreciation and amortization | 552 | 504 | 465 |
| R&D expenses | 159 | 145 | 124 |
| Free cash flow | 495 | 548 | 235 |